How to Read Forex Charts
People who work in the foreign exchange market need to be able to read forex charts. Traders can use these charts to make intelligent decisions by seeing how different currency pairs move. This article will discuss various types of forex charts, their main features, and the right way to read them.

Different Kinds of Forex Charts
Different types of forex charts show price changes in various ways. Traders use three main types of charts: line charts, bar charts, and candlestick graphs.
Line charts show the value of different currency pairs at the end of a specific time frame. They are the most straightforward type of trading chart to use. They show fundamental price trends but go into less detail than other maps.
Bar charts show how prices change over time with bars that go up and down. Each bar shows the spread of prices between the high and low points for a certain period. Bar charts are better than line charts because they show more information, like beginning and finishing prices.
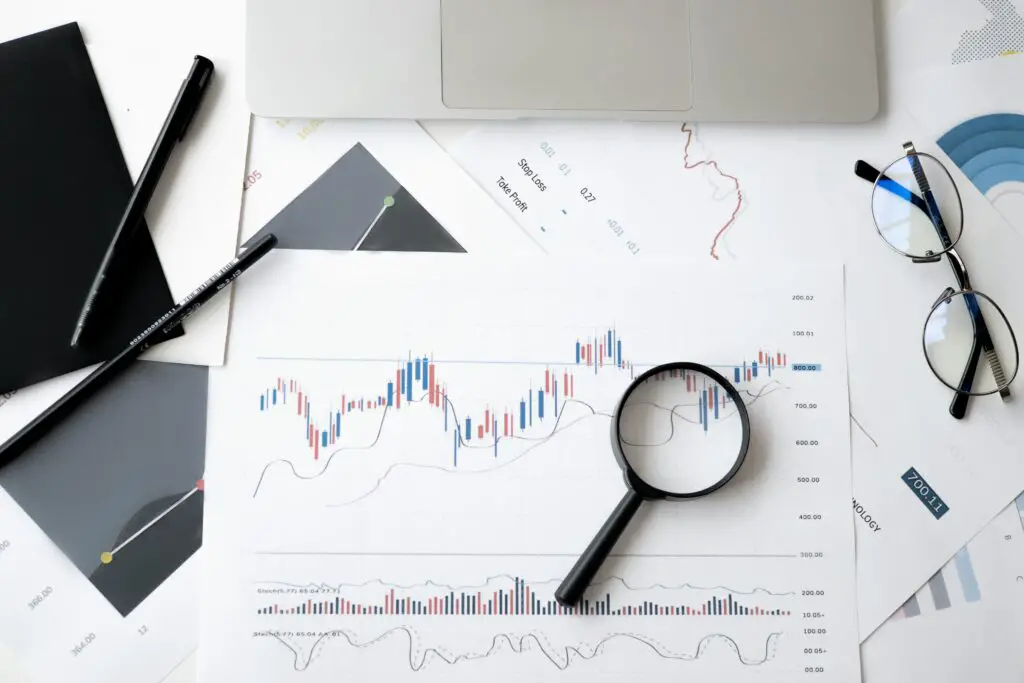
Charts with Candlesticks: Many forex traders like candlestick graphs because they can show much data simultaneously. Each candlestick shows different prices for a certain amount of time. The tips show the high and low prices, while the body shows the beginning and end prices when prices might change by looking at the shapes of the candles.
Essential Parts of Forex Charts
There are a few essential parts of all forex charts that must be analyzed no matter what type of chart they are:
On a forex chart, the prices of the examined currencies are shown on the line that goes up and down.
Timeline: The price range being examined is shown on the horizontal axis of a forex chart. Depending on the time range, it could be minutes, years, or even longer.
Price Data: These are the actual prices shown on the graph, which shows how prices have changed over time.
Many traders use moving averages, such as MACD and RSI, which are technical indicators, to help them find trends, momentum, and good times to enter or exit a trade on Forex charts.
How to Read Forex Charts
To read forex charts, you need to understand the market, know how to use fundamental analysis and have done it before. Here are some essential things to remember when looking at forex rates:

Trend Analysis: To trade smartly, you must know the present trend. On the other hand, trends can stay the same (consolidation) or go up (bullish). You can use moving averages, trendlines, and the ability to see PA to find trends.
Support and Resistance Levels: Price points where there is a lot of pressure to buy (support) or sell (resistance) are called support and resistance levels. Prices cannot fall below or above these levels, so they help you figure out when to start or leave a trade.
Shapes on the Chart: Shapes, such as flags, heads shoo, elders, and circles, can tell you a lot about how prices may move. Traders can spot these patterns to tell when a trend will change or stay the same.
Candlestick Patterns from Japan: Forex traders use these patterns to determine how the market is doing and guess how prices will move. We can learn much about the balance between bulls and bears from how the candle bodies and wicks are set up. Patterns of candles like the hammer pattern, the goji, the shooting star, and the expanding pattern all show that the current direction could change or stay the same. If Forex traders can see these trends on the charts, they can trade more accurately and make better decisions.
Looking at Forex Charts
Learning how to read and understand Forex charts to make intelligent trade decisions would be best. Traders use several essential analysis tools and indicators to look for trends, levels of support and resistance, and possible entry and exit points. When people look at charts, they usually use moving averages, trendlines, Fibonacci retracements, and measures like Diver Divergence (MACD). I can guess how prices will change with these tools and an understanding of traders.
Making a chart of strategies and best practices
To make good charts, you need to know how things work technically and strategically—having trade goals and rules for managing risk and sticking to a focused approach. It is critical to get a complete picture of market trends if you look at data from more than one time period. Getting into the market in shorter time frames can help. On the other hand, more extended time frames can show you where the market is going. You can make better choices with the help of fundamental and technical studies because economic data and political events can change how coins move.

How Prices Move: A Guide
The Forex charts show how prices change over time. This is known as “price action.” Price action analysis looks for patterns, trends, support res, resistance levels, and how the market works to guess how prices will move. Traders use shapes on the chart, such as triangles, flags, and head and shoulders, to decide when to start and exit a trade. If traders know the critical support and resistance levels, they can also find the best levels to set their stop loss and take profit orders. This lowers the risk and raises the income.
The Mind of Trading
When you look at Forex charts, you need to know about trade psychology because emotions can cloud your judgment and lead you to make bad choices. Fear, greed, and anger can make sellers do bad things that lead to wrong results. Traders must be disciplined, patient, and emotionally strong to keep their thoughts clear and reasonable while looking at Forex charts. Traders can get past their mental blocks and make money over time by making a good trading plan, following the rules for risk management, and learning from their wins and losses.
In conclusion
It would help if you learned to read forex charts to do well in the foreign exchange market. Traders can learn much about how prices move and make smart trading decisions by understanding the different types of forex charts, the crucial parts they show, and the right way to read them. If you want to be a much better trader, no matter how much experience you have, you should learn to read and understand Forex charts.

